Pros
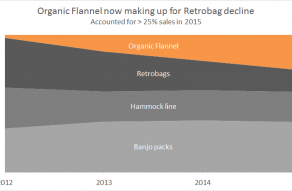
Can show trends over periods of time Can show component contribution changes over time
Cons
Non-intuitive presentation may be unfamiliar to many Hard to read as data series are added
Author
Dave Bruns
Hi - I’m Dave Bruns, and I run Exceljet with my wife, Lisa. Our goal is to help you work faster in Excel. We create short videos, and clear examples of formulas, functions, pivot tables, conditional formatting, and charts.