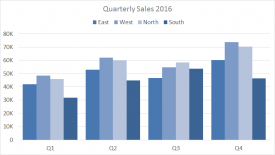
Like all stacked bar charts, the first data series (next to the axis) is easy to compare visually, but subsequent data series are harder to compare, since they aren’t aligned to a common element.
Pros
Able to show part-to-whole changes over time Multiple categories and data series in compact space
Cons
Difficult to compare all but first series Stacked bars normalized to 100% so absolute value dimension is lost Become visually complex as categories or series are added
Tips
Limit data series and categories Avoid all 3d variants
Author
Dave Bruns
Hi - I’m Dave Bruns, and I run Exceljet with my wife, Lisa. Our goal is to help you work faster in Excel. We create short videos, and clear examples of formulas, functions, pivot tables, conditional formatting, and charts.