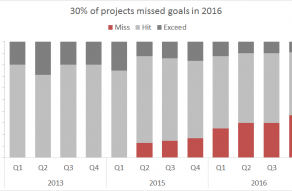
Although stacked column charts can show the change over time of a part-to-whole relationship, it’s generally difficult to compare the relative size of the components that make up each column.
Pros
Multiple categories and data series in compact space Can show part-to-whole changes over time
Cons
Difficult to compare all but first series Become visually complex as categories or series are added
Tips
Limit data series and categories Avoid all 3d variants
Author
Dave Bruns
Hi - I’m Dave Bruns, and I run Exceljet with my wife, Lisa. Our goal is to help you work faster in Excel. We create short videos, and clear examples of formulas, functions, pivot tables, conditional formatting, and charts.