Pros
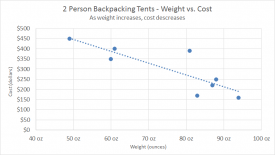
Can show the relationship of one variable to another Unique ability to show data about a third dimension Can visually display correlation
Cons
Unusual chart type may be difficult to ready for many people More difficult to set up than other chart types
Author
Dave Bruns
Hi - I’m Dave Bruns, and I run Exceljet with my wife, Lisa. Our goal is to help you work faster in Excel. We create short videos, and clear examples of formulas, functions, pivot tables, conditional formatting, and charts.