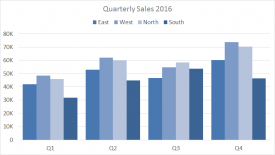
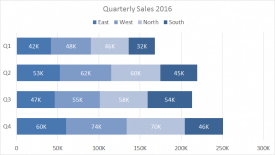
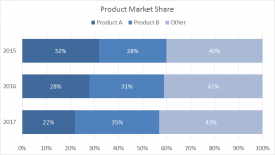
Column charts work best where data points are limited (i.e. 12 months, 4 quarters, etc.). With more data points, you can switch to a line graph.
Pros
Easy to read Simple and versatile Easy to add data labels at ends of bars
Cons
Become cluttered with too many categories Clustered column charts can be difficult to interpret
Tips
Add data labels where when it makes sense Avoid all 3d variants
Author
Dave Bruns
Hi - I’m Dave Bruns, and I run Exceljet with my wife, Lisa. Our goal is to help you work faster in Excel. We create short videos, and clear examples of formulas, functions, pivot tables, conditional formatting, and charts.