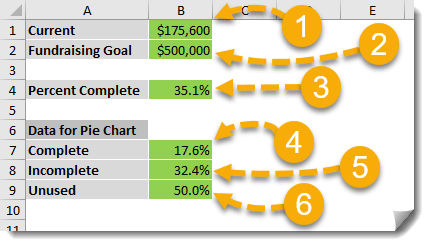
In a previous post I showed you How To View Actual Versus Target With A Thermometer Style Chart and in this post we’re going to look at how to display similar information in a gauge chart. Excel doesn’t have a gauge chart option, but we can use a pie chart to create something that looks like a gauge. In this example we’ll chart the current amount raised against a fundraising goal.
We’ll need to set up a few fields in our spreadsheet to start.
Insert a pie chart.
The result will not automatically look like a gauge, we will need to make some adjustments.
Add some labels such as 0% and 100% as gauge marks using a text box and we now have something that looks like a gauge that’s been constructed out of a pie chart! It’s a cool pie chart hack that’ll add some style to your dashboards.