Not to be mistaken with Excel Tables, Data Tables are a tool that can be used to do “what if” type analysis and allows you to see the results of a calculation while varying up to two of the calculation inputs. In this example we’ll create a data table based on the accumulated value of a bank deposit that earns interest (i.e. how much money will we have after a given time at this interest rate). Our inputs for the calculation are the principal amount, term of deposit and interest rate earned. We’ll use a data table to explore what happens to the accumulated value if the term or interest rate changes.
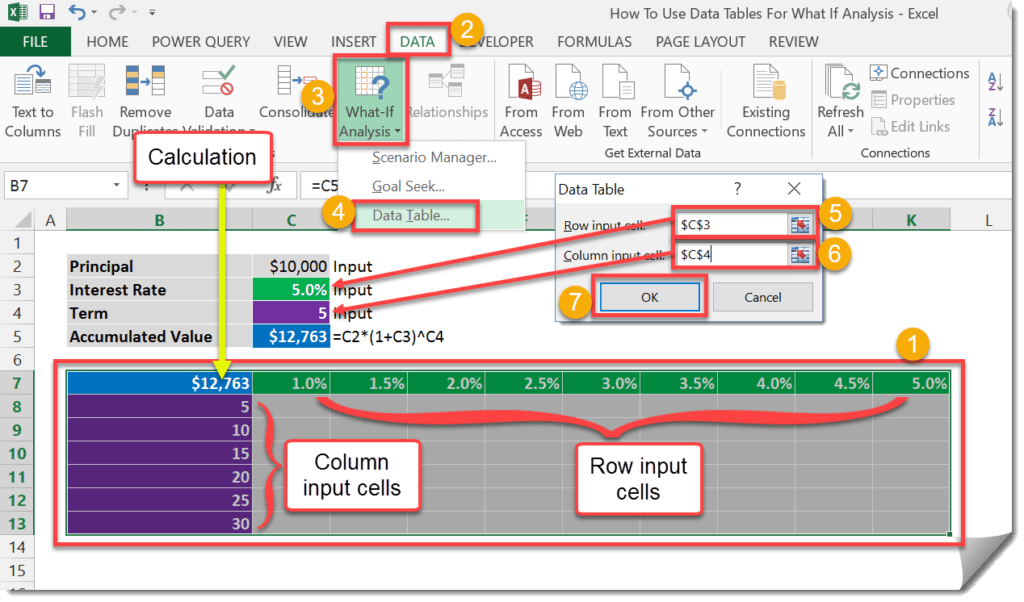
We have our calculation inputs in C2:C5.
Principle (C2) – This will be fixed at $10,000 for our example.Interest Rate (C3) – This is one of the inputs that will vary in our data table.Term (C4) – This is one of the inputs that will vary in our data table.Accumulated Value (C5) – This is the calculation our data table will be based on.
Create the Data Table in the range B7:K13.
You might be asking what’s so special about this and why didn’t we just input this accumulated value formula into cell C8 and copy it across the range C8:K13? Imagine you work at a credit rating agency and you have super complex calculation to determine the credit rating given to a company. The calculation might be done over many sheets and have many inputs but results in a single value of the credit rating being returned. This complex calculation would not be possible to put into a single cell and copy it across like in our simple example. A Data Table would be the only viable solution to analyse multiple results based on varying inputs in this case.