Adding symbols into your tables or charts can be a great visual aid to your numbers. In this example we’ll look at how we can add up and down arrows into our number formatting to show increases or decreases in our data. The symbols we’re going to use are unicode characters which are actually a standard across any platform and are available on any language PC.
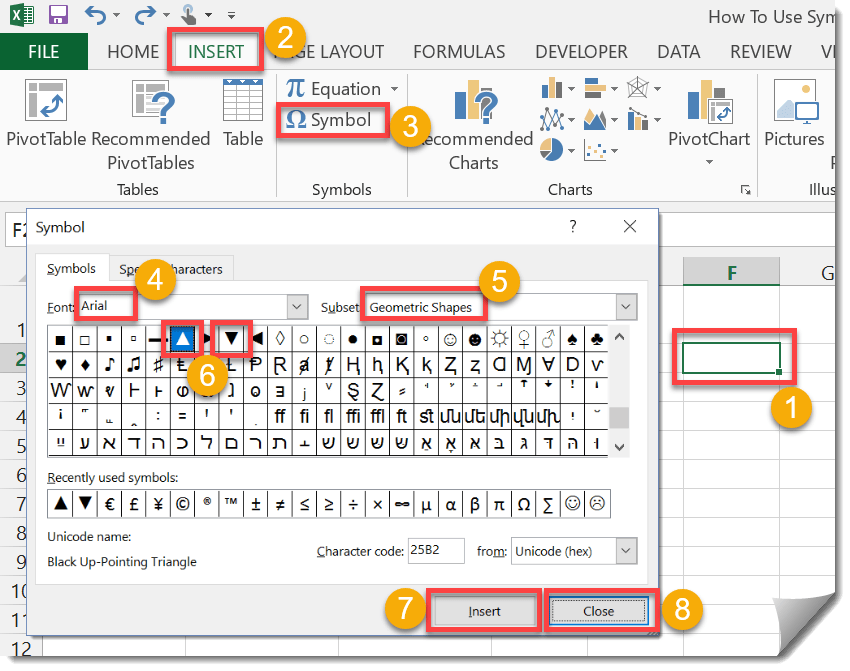
Step 1: Accessing Symbols in Excel
We’ll need to insert the symbols we want to use into our workbook. You can now use these symbols later by copying and pasting them from the cell you inserted them into.
Step 2: Adding Symbols To Your Table Formatting
We can add symbols into our table data using cell formatting.
Step 3: Add A Bar Chart Using Your Data
Charts will automatically take on the formatting of the data used so our chart will also have a nice visual appeal.
If your bar chart doesn’t contain the symbols then you can add them in.
Now you have a cool graph with easy to see information about the change in sales since last year. The formatting is dynamic so if you update your data the symbols in the table and graph will update accordingly.