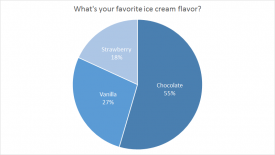
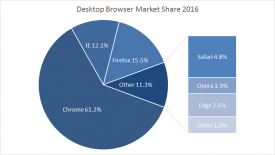
Pie charts work best to display data with a small number of categories (2-5). The Pie of Pie Chart provides a way to add additional categories to a pie chart without generating a pie chart too complex to read. When configuring a Pie of Pie chart, Excel provides a setting that moves the smallest n slices of the pie to another smaller pie, where n can be adjusted to suit the data. Pie of pie charts should be avoided when there are many categories, or when categories do not total 100%. The human eye has trouble comparing the relative size of slices in a pie chart, and this problem is compounded with the pie of pie variety.
Pros
A simple way to handle more categories in a pie chart Can be read “at a glance” with limited categories Excel can calculate and display percentages automatically as data labels
Cons
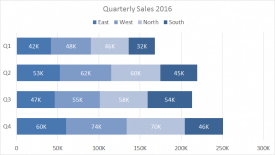
Difficult to compare relative size of slices Become cluttered and dense as categories are added Limited to part-to-whole data Poor at showing change over time
Tips
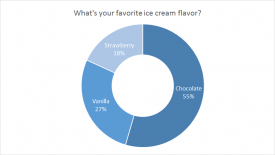
Limit categories Avoid all 3d variants
Author
Dave Bruns
Hi - I’m Dave Bruns, and I run Exceljet with my wife, Lisa. Our goal is to help you work faster in Excel. We create short videos, and clear examples of formulas, functions, pivot tables, conditional formatting, and charts.