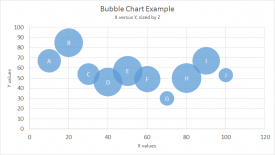
By convention, the X axis represents arbitrary values that do not depend on another variable, referred to as the independent variable. Y values are placed on the vertical axis, and represent the dependent variable.
Pros
Can show the relationship of one variable to another Visual display of correlation Ideal for many types of scientific data
Cons
Not as well understood as many other chart types Suitable only for data where correlation is expected
Author
Dave Bruns
Hi - I’m Dave Bruns, and I run Exceljet with my wife, Lisa. Our goal is to help you work faster in Excel. We create short videos, and clear examples of formulas, functions, pivot tables, conditional formatting, and charts.