Pros
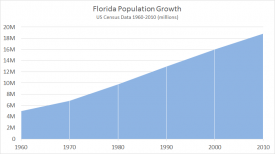
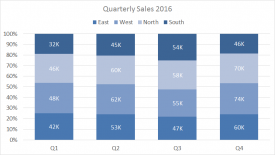
Simple presentation can be red at a glance Can show part to whole changes over time
Cons
Generally harder to add data labels since there is less white space available Area charts can imply more data than actually available
Author
Dave Bruns
Hi - I’m Dave Bruns, and I run Exceljet with my wife, Lisa. Our goal is to help you work faster in Excel. We create short videos, and clear examples of formulas, functions, pivot tables, conditional formatting, and charts.